_October2013_small-c5284e74ed9ef79f612813617b47061d92bf282e0f0f8ff07179efcb1aa8cc1a.jpg)
|
Research & Analysis for Business and Investment Clients |
|
Incentives in the United States Personal Income Tax Schedules - 2009
Incentives drive behavior. How does the United States personal income tax schedule incentivize taxpayers?
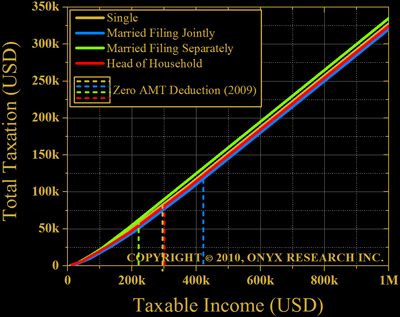
Federal tax tables define distinct tax brackets with rates ranging from 10-35%. A plot condensing this information into one graph is presented in Figure 1.
 Figure 1. Total taxation as a function of taxable income & filing status (derived from 2009 tax table). Dashed lines identify the alternative minimum tax zero exemption thresholds for 2009.
What incentives exist based on Figure 1?
1. Marriage: It pays to be married and file jointly. As benefits build with time, it pays to marry early (from a purely financial perspective).
2. Married (filing separately): Separation and divorce are discouraged. It pays to maintain a good relationship with your spouse and avoid spouses who refuse to file (forcing you to file your return separately).
3. Head of household: It pays to change your situation such that you can file jointly with a spouse.
Complicating the matter, the Alternative Minimum Tax (AMT) is a parallel tax system ensuring deductions like California king size mortgage interest payments, financial instrument exclusions, or asset property dispositions do not generate an unusually favorable tax situation.
This system generally kicks in and becomes complex when individuals/couples have high income (consult your tax advisor if such challenges arise). Compute taxation with the standard table and AMT calculator. You pay the higher of the two computed values.

Note 1: In 2010 the AMT exemption is scheduled to decrease to $33,750 (single), $45,000 (joint), and $22,500 (separate). In 2009 the AMT exemptions were $46,700 (single/head), $70,950 (joint), and $35,475 (separate).
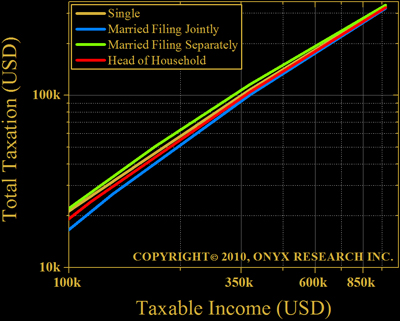
 Figure 2. Total taxation as a function of taxable income & filing status (derived from 2009 tax table). Use this log-log plot to see how much your taxation changes with filing status.
Note 2: For 2009 the zero exemption thresholds were $299,300 (single/head), $433,800 (joint), and $216,900 (separate).
Disclaimer: Onyx Research, Inc. does not provide tax advice. Consult your tax advisor to optimize your tax situation.
Data Source: Internal Revenue Service
Looking for knowledge unique to your needs? Click on the Onyx Premier Black icon below.

