_October2013_small-c5284e74ed9ef79f612813617b47061d92bf282e0f0f8ff07179efcb1aa8cc1a.jpg)
|
Research & Analysis for Business and Investment Clients |
|
World Bank Elephant Graph - U.S. Income Overlay
The Global Wealth Distribution Debate
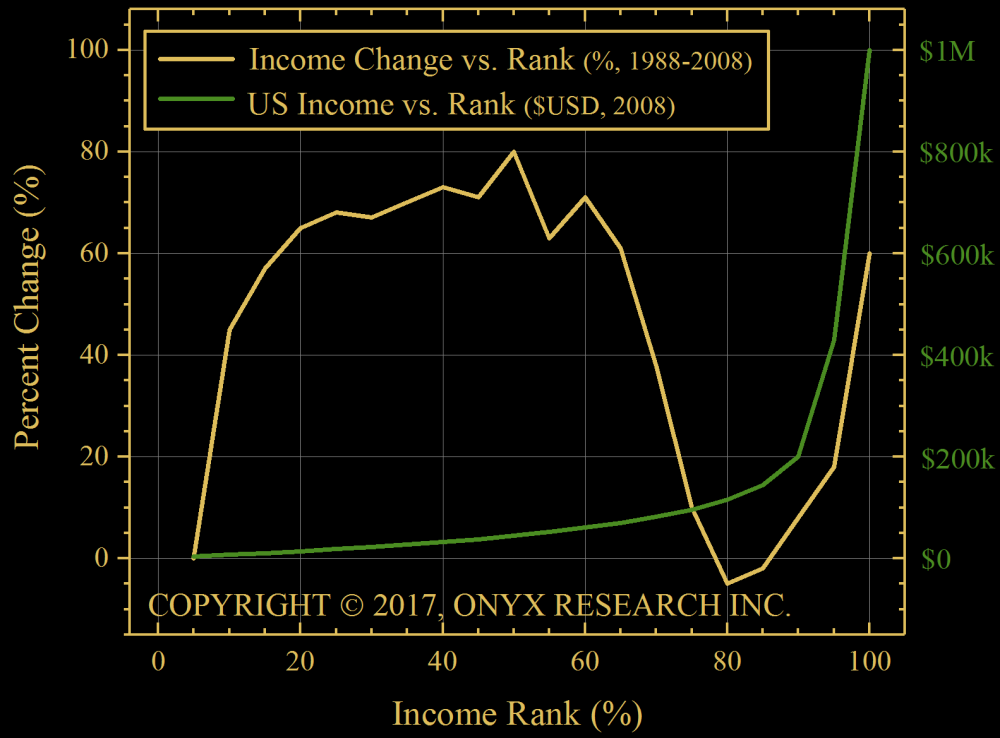
Recent political upheaval in the U.S. and U.K. has generated much speculation regarding the political populace and global wealth. One graph that has received much attention is the World Bank elephant graph. The popular press has suggested that this graph underpins what brought Donald Trump to power—the export of American middle-class jobs to foreign countries. Onyx Research has plotted U.S. annual household income on the same graph. While true that globalization has brought a massive supply of inexpensive labor to market, the trunk of the “elephant” is likely the result of global digital transformation. It shows that a majority earns money by exchanging time for an income and a minority does not. The sharp trunk trough is certainly interesting. It likely shows that the top 10% earn money in other ways. They may be highly skilled or independently wealthy people (senior managers, entrepreneurs, bankers, lawyers, doctors, or trust fund recipients). This segment likely generates a significant income from investments and may employ less skilled labor. The gap between the two groups likely shows that business success is on average binary. Your firm dominates a market, or you fall back from employer/investor to employee status.
