_October2013_small-c5284e74ed9ef79f612813617b47061d92bf282e0f0f8ff07179efcb1aa8cc1a.jpg)
|
Research & Analysis for Business and Investment Clients |
|
Home
|
Research
|
Mission
|
Interaction Process
|
Firm History
|
Contact Onyx
|
FAQ
|
Quality Content
Net Worth Cumulative Probability Distribution – United States
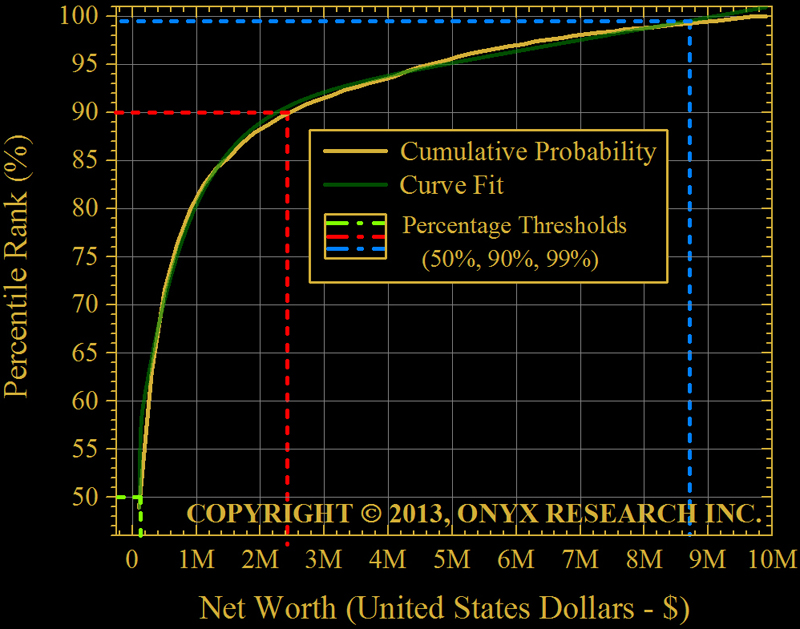
The graph above plots the US net worth cumulative probability distribution. Use this plot to see where you rank in terms of net worth. To determine your rank, find your net worth on the x-axis and move vertically along the y-axis until you touch the yellow curve. Match this intersection point to the cumulative probability value on the y-axis label. This probability is your net worth ranking. For example, let's say that your net worth is $1,000,000 ($1M). You would be in the 81st percentile. That means that your net worth is higher than approximately 81 out of every 100 people you see on the street.

Custom Search