_October2013_small-c5284e74ed9ef79f612813617b47061d92bf282e0f0f8ff07179efcb1aa8cc1a.jpg)
|
Research & Analysis for Business and Investment Clients |
|
Smoke em if You got em: Carbon Dioxide Emissions Exceed 30 Gigatons
China, India, South Korea, Iran, & Iraq Grow Exponentially
Chain smoking world powers puff fossil fuels at impressive rates.
Energy release being the lucrative combustion concern, CO2 emissions are a good growth indicator.
Figure 1 plots world carbon dioxide (CO2) emissions from 1850 on. Climbing past 30 gigatons in 2007, solid, liquid, and gas emissions show strong growth. Dotted lines define shifts in demand from solid to liquid (~1915) and transition to gas phase fuels (~1975).
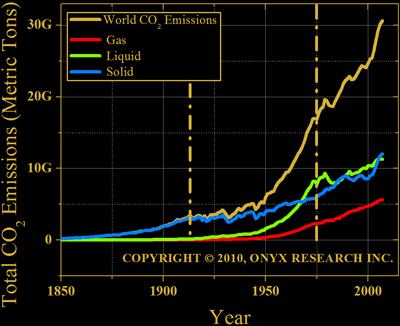 Figure 1. World CO2 emissions. Gold line plots aggregate emission (>30 gigatons). Red, green, and blue curves plot gas, liquid, and solid emissions.
Top Ten Emitting Countries
The top five emitters are, in order, China, the United States, India, the Russian Federation, and Japan. Figure 2 plots each countries total emissions growth over time.
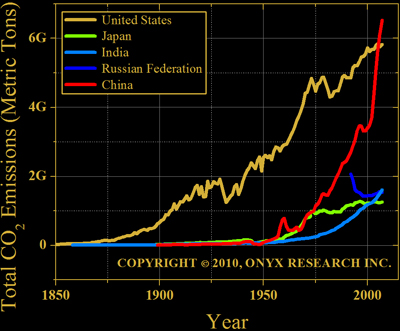 Figure 2. Top five CO2 emitting countries. China ranks first with exponential growth. The United States second with exponential increases reduced to linear growth in recent years. India is third with exponential emissions growth. The Russian Federation fourth and Japan fifth. Both exhibit negligible emissions growth.

Notably, China and India climb at a nonlinear pace. China's fossil fuel use is remarkable—the red line plotting emissions growth nearly vertical when compared to the other four countries.
China and India emission growth rates are nearly identical when considering all available data, with India trailing China by ~20 years (see page 2). In recent years, however, China's emissions growth has climbed exponentially by double digits (~10% year-on-year).
The next five emitters are Germany, Canada, the United Kingdom, South Korea, and Iran. Figure 3 plots each countries total emissions growth over time.
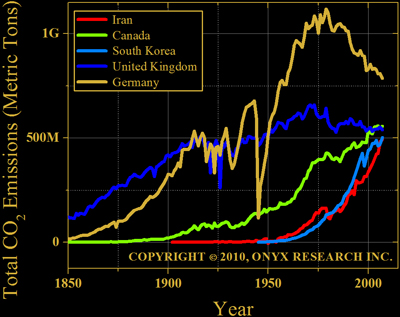 Figure 3. Next five CO2 emitting countries. Germany is sixth with decreasing emissions in recent years. Canada is seventh with small emission gains recently. The United Kingdom also shows decreased emissions in the past decade. Iran and South Korea both exhibit exponential growth.
With exponential growth from major world powers, it is no surprise energy costs reach new heights. Coal, oil, and gas have seen strong price fluctuations recently. A detailed oil price analysis can be found in the Onyx Research report on Oil Price Fluctuations.
With data in view, petroleum price shocks observed in 2008 follow logically. Neither hedge fund nor speculator drives world energy prices like exponentially growing world superpowers.
